
PAE (Pragmatic AI Enablement) is our internal program. Each week, one person picks up an AI topic, gets three days to experiment, and one day to write up the results. We show code fragments as well as the common pitfalls that rarely get talked about.
The agent we’re building in the program is an advisor following our PAF methodology, the Pragmatic Automation Framework. It talks with the client about the automation goal and checks whether all the necessary facts have been established. By default it runs on an API model. This week was about whether we could put it on a model running on a single machine in the office.
You Have One Machine and Dozens of Models
The machine is a mini-PC with an AMD Ryzen AI Max+ 395 (Strix Halo): 128 GB of unified memory, integrated Radeon 8060S graphics. Dozens of models fit on it. An online leaderboard won’t tell you which of them can carry a conversation in Polish, correctly call our tool, and do it fast enough that the conversation doesn’t stall.
In week 3 we measured one thing: the same set of 18 scenarios scored 18/18 on the API model and 2/18 on a local model picked at random. The model choice turned out to be a design decision, not a cosmetic one. This week’s task: turn that single data point into a ranked list, measured against our scenarios.
Is self-hosting even worth it? At low API volume it’s cheaper. Local hardware only pays for itself at tens of millions of tokens a month. But there’s an argument price can’t beat: client data can’t leave the company anyway. That was the reason to check.
Why a Local Model Can Be Slow, and What That Means for the Choice
We rank the list by two numbers: how many scenarios a model passes and how fast it responds. Let’s start with speed, since that’s where most of the surprises are.
Short answer: speed is decided by memory bandwidth, not compute. During generation, the model
reads all of its active weights once per token, so
tok/s ≈ memory bandwidth ÷ bytes per token. Our machine has a single memory pool shared
between CPU and GPU (128 GB, ~256 GB/s). A dedicated graphics card has its own memory just for
the GPU (VRAM), but several times faster, on the order of 1000 GB/s. That gives us four things
to look at.
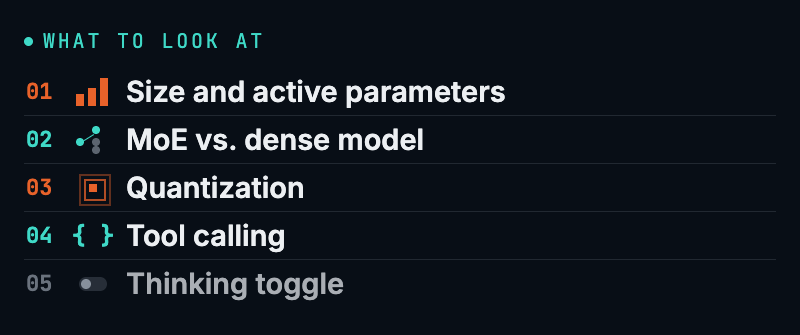
Size and active parameters. 128 GB means capacity is almost never the problem. The problem
is how many bytes need to be read per token. qwen3.8:27b weighs 17.7 GB → a ceiling of
~14 tok/s, 13 measured. A faster CPU won’t fix that. The only way out is to reduce the actual
number of weight bytes read per token: a smaller model, heavier quantization, or MoE.
MoE vs. dense model. A dense model activates all parameters on every token. MoE (mixture of
experts) has a lot of parameters in total, but for a single token it only runs a few “experts”:
qwen3.6:35b-a3b is 35B total and ~3B active. On this card, MoE reads a fraction of the bytes
and is noticeably faster. A quick test for what a given model actually is: multiply tok/s by
the file size in GB. If it comes out above 256, the model can’t be dense. gemma4:26b does
~40 tok/s at 17 GB, meaning “if it were dense” it would need ~680 GB/s. Impossible, so it’s
MoE, even though the name doesn’t say so. The price of MoE: more known tool-calling bugs in
Ollama.
Quantization. The same model in Q8 weighs twice as much as in Q4, and decodes proportionally slower. It’s tempting to go lower, but Q4_K_M is described as the floor. Below that, the thing that degrades is exactly what we care about: JSON reliability in tool calls. Q4 can throw invalid JSON under load. We take Q8 wherever latency allows it.
Tool calling. The agent reports state through a tool call; a model that doesn’t do that simply doesn’t work. A “supports tool calling” flag in the registry isn’t the same as “calls it reliably.” Ollama doesn’t grammar-constrain arguments, so a weaker model sends broken JSON or skips the call despite an unambiguous message. We check this directly. The same point keeps coming up elsewhere too: for an agent, what matters isn’t the parameter count, it’s whether the model actually hits the tool.
A fifth, smaller axis: the thinking toggle. A model that always “thinks” generates hundreds of invisible tokens per turn and looks like slow hardware. We’ll come back to this in the Ollama section.
How We Narrowed the List
We pull candidates from ollama.com/search?c=tools
cross-referenced with openrouter.ai/api/v1/models, then query the Ollama registry for the
exact size of the specific variant. llmfit didn’t make the cut: its model database is
outdated and doesn’t know the variants we cared about. Online leaderboards can, at best, point
you to which model family to look in. They won’t answer “will it carry our conversation in
Polish and call our tool.” Only our scenario set answers that.
The Test Suite as a Gate, Not a Ranking
The week 3 suite has one property that paid off now: the agent and the judge run on separate
connections. The agent runs on the local model under test, while a cloud model (gpt-5.6-sol)
judges it. The judge stays the same throughout, because in week 3 swapping the judge alone
moved the score from 61% to 11%. Swapping the agent’s model is a single environment variable,
and a sweep is just a loop over the model list: one result row per model.
The funnel. Full suite × number of models × repeats is a weekend, not a night. So first, a cheap smoke stage: four deterministic scenarios with no judge. They check things a model must not do, just to qualify for consideration at all (leaking internal fields under attack, wiping an established criterion on a side turn). Any failure is elimination. Out of 20 models, five passed smoke.
We moved the smoke bar after looking at the data. It originally had 10 scenarios, including ones scored by the judge. When it turned out no model was hitting it, we checked whether the line was in the right place. It wasn’t: “politely paraphrased its own rules” is a judge’s opinion, not a hard safeguard. Four scenarios remained, all checkable with a plain condition in code.
The suite grew from 18 to 28. A good model passed all 18, so the suite no longer discriminated at the top of the scale. We added: the full path to goal confirmation, value correction vs. contradiction, numbers and dates in tool arguments, conversation window memory, over-eager refusal. The CI threshold dropped from 60 to 50, because at a different suite size the old threshold isn’t comparable.
The suite found bugs in our code, not just in the models. One model blew up an entire turn with an exception because it sent a tool field in a different shape. Another wiped established state while “tidying up” after an off-topic question. These aren’t model quirks to wait out. They’re things that will derail a conversation in production regardless of the model. So the backend got: lenient parsing of broken JSON (recover instead of throw), a gate that won’t let an established criterion be rolled back to “none,” and a separate state-classification call for turns where the model skipped the tool. Only with that in place can you take a model that’s fast but temperamental.
Results
Judge: gpt-5.6-sol, agent on its own card. Results averaged across runs, spread in
parentheses.
| Model | Pass rate | Median tok/s | Median turn |
|---|---|---|---|
laguna-s-2.1 | 93% | 18 | ~10.6 s |
gemma4:26b | 73% | 40 | ~3.1 s |
qwen3.8:27b | 73% | 13 | ~11.8 s |
qwen3.6:35b-a3b-q8_0 | 41% | 37 | ~4.8 s |
gemma4:31b | 36% | 36 | ~4.8 s |
gpt-oss:20b | 18% | 46 | ~14.7 s |
glm-4.7-flash | 14% | 41 | ~8.2 s |
| ceiling: GPT via API (week 3) | ~100% | — | — |
Passing smoke doesn’t make a good agent. gpt-oss:20b and glm-4.7-flash pass all four
blockers, then score 14–18% on the full suite: they zero out on guardrails and off-topic
scenarios. Smoke filters out disasters, it doesn’t pick a winner.
One run isn’t a result. qwen3.8:27b scored 82% on its first run. A second pulled it down
to 73% with a 64–82 spread, and put it on par with gemma4:26b — which is three times faster
besides.
More parameters doesn’t buy quality. gemma4:31b (36%) scored worse than the smaller
gemma4:26b (73%). qwen3.6:35b-a3b (41%) worse than qwen3.8:27b. Training generation, on
the other hand, clearly matters: older qwen3:* models failed smoke, qwen3.6 and qwen3.8
passed.
We picked gemma4:26b, and in doing so broke our own criterion. The rule was supposed to
be “pass rate first, speed second,” and laguna-s-2.1 has 93% against gemma’s 73%. Latency
decided it: for a live conversation, a ~3s turn versus a ~10s turn is the difference between
“usable” and “not.” Gemma stays above the bar; laguna goes back in the queue once we add prompt
caching. For now, fast-and-good-enough beats slower-and-better-on-paper.
Worth adding context: the previous ADR moved away from gemma precisely because of unreliable tool calling. We’re coming back to it because the backend is now hardened enough to recover from its slip-ups.
What We Changed to Stop the Model From Hanging
gemma4:26b gives a turn around three seconds. On the first run, before we changed anything,
the same class of conversation took 30–100 seconds per turn, and a full suite run could take
30 minutes. Today it’s down to 3–4 minutes. Before blaming the hardware, we checked what was
misconfigured.
On-machine diagnostics. ollama ps shows a PROCESSOR column. If it doesn’t say
100% GPU, the model is running partly on CPU, and that’s where the speed disappears. For us
it was 100% GPU, but the UNTIL column kept showing Stopping..., meaning the model was
dropping out of memory between turns. rocm-smi --showclocks added another clue: a
“low-power state” warning and the Infinity Fabric clock (fclk) sitting at the fourth of seven
levels.
What we changed:
OLLAMA_KEEP_ALIVE. Without this, ollama cleans models very aggressively. Between chat messages, ollama had to pause and reload the model each time. Also, in tests, the model was loaded and cleaned each time between tests. A simple test series lasted 30 minutes instead of 3 minutes.OLLAMA_MAX_LOADED_MODELS=1. One model in memory at a time. Without this, when switching models during a sweep, Ollama briefly holds two and the memory budget blows out.- GPU power state (
power_dpm_force_performance_level=high). Unlocksfclkfrom 1600 to 2000 MHz and stops the chip from idling down between tokens. A double-digit percentage of bandwidth. The change is reversible but doesn’t survive a machine restart: to make it permanent you need to wire it into systemd or udev. - Disabling hidden reasoning (
reasoning_effort: none). On the same prompt, the model generated 278 tokens instead of 54. Per-token speed unchanged, but wall-clock time three times shorter. Some families (Qwen) ignore this parameter and need/no_thinkin the prompt.
What we didn’t dig into: context 64k → 16k, flash attention, the number of parallel requests. Each would have helped somewhat, but once we disabled reasoning and picked gemma, the turn was down to ~3 seconds and there was no need.
Where the speedup actually came from. The hardware settings alone gave 20–40%, not 3x. That original 30–100 seconds came from three things at once: reasoning being on, a 64k context, and a ~6,000-token system prompt recomputed from scratch every turn, because prompt caching doesn’t work. The rest of the difference came from picking a faster model. Decoding itself can’t be pushed any further: 40–47 tok/s is roughly the physical ceiling of this card for models in this class. As a side effect, we closed out a question from the previous ADR: the Ollama backend on this card is ROCm, not Vulkan.
The Judge (LLM-as-a-Judge): Cloud or Local Card
Some of quality is checked by a plain condition in code. The rest can’t be caught that way, which is what the LLM judge is for. It has to stay the same across the whole benchmark: in week 3, swapping the judge alone moved the same agent from 61% to 11%. We checked whether the judge could also run locally.
A specialized judge (prometheus2), trained specifically to score answers, turned out to be a
bust: it answers in English and can’t evaluate a Polish conversation.
Specialized judge models are English-only in practice,
which closes the door for an agent conversing in another language. A general multilingual model
did better: gemma4:26b judging its own outputs gave 68%, against GPT’s 68–79 band. But that’s
one run, 3 of 6 categories shifted per scenario, and the model is judging itself. A similar
overall score isn’t enough to call this settled. We’d need to run the same transcripts through
both judges and compare their scores against a hand-scored sample. That’s a debt carried over
from week 3. For now, the judge stays in the cloud.
What It Looks Like Once Stabilized
gemma4:26b through the horusllm profile, hardened backend, reasoning off. After a week of
tuning, one conversation from start to finish looks like this:
The client states the goal over a few turns, the completeness panel updates after each one, and each turn comes in around three seconds. One side turn, an off-topic question: the agent deflects, and the established state stays intact.
| before | after | |
|---|---|---|
| turn | 30–100 s | ~3 s |
| full suite run | ~30 min | 3–4 min |
| tool call | blows up the turn with a parser exception | recovered via lenient parsing |
| state on a side question | wiped | held by a backend gate |
| ”thinking” tokens per turn | ~280 | ~50 |
Same example but on qwen3.8:27b
“Stabilized” doesn’t yet mean “API-level.” It’s still 73% on the tightened suite, extraction still occasionally gets lost, and a separate post-turn call catches that. It’s enough for an internal demo; for now, clients still get the API model.
What We Learned
- With an agent, you’re buying tool-calling reliability, not parameters. 20 models flagged “tools” in the registry, 5 passed smoke. A model that’s brilliant at reasoning but doesn’t hit the tool is useless as an agent.
- Training generation matters more than size.
qwen3:*filtered out,qwen3.6andqwen3.8passed.gemma4:31bworse than the smallergemma4:26b. You can’t guess the size that matters, you have to measure it. - One green run isn’t a result.
qwen3.8:27b’s drop from 82% to 73% came purely from a second run. Comparing models requires repeats and looking at the spread. - What it feels like to use comes down mostly to turn latency. ~3s versus ~12s is the line between “conversation” and “waiting for a reply.” Hidden reasoning crosses that line silently, because the model just looks stuck.
- A local model still doesn’t match the API, but the gap is closeable. The best result is 93%, the API ceiling is ~100%. We can name the gaps: measurement repeatability, prompt caching, further backend hardening. The road to production is real, just not driven all the way yet.
What’s Next
- Full cost comparison: API vs. on-prem for one completed conversation. A separate week.
- Observability: tracing, tokens, logs — what the model does inside a turn, what it costs, and where it breaks. In upcoming weeks.
—edit Models Ship Faster Than You Can Measure Them
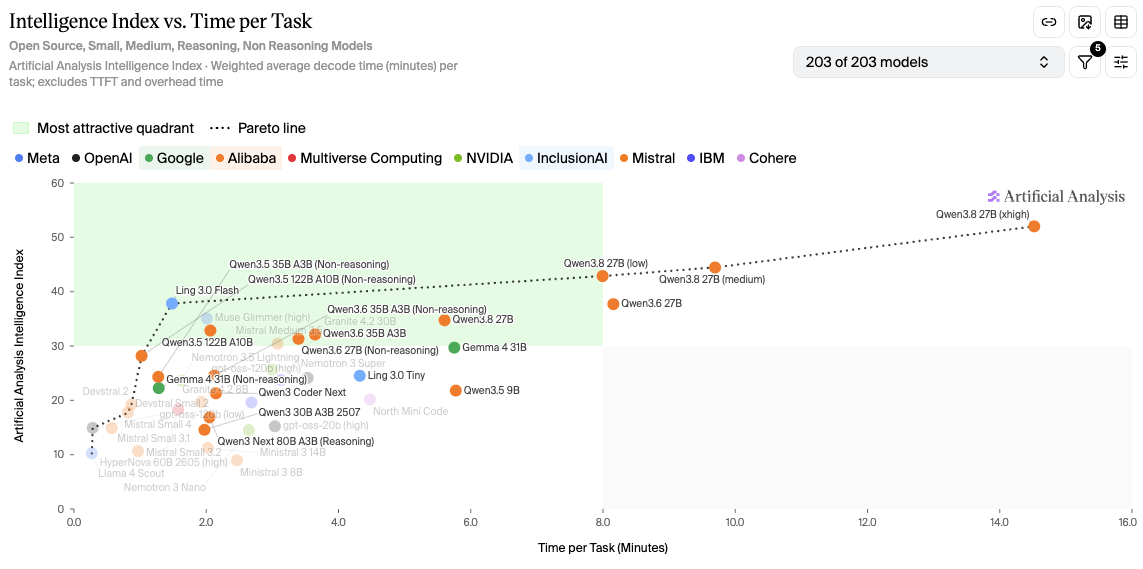
Chart: Artificial Analysis — Intelligence Index vs. Time per Task, captured 4 September 2026. Not our own measurements.
A last-minute example: Ling-3.0-flash from
inclusionAI, released in August 2026. It has 124B parameters, of which only ~5.1B are active per
token, a hybrid attention mechanism (KDA + MLA), 256k context and an MIT license. On the chart it
holds the same index as Qwen3.6 27B at five times less time per task — exactly the profile we’re
looking for on 128 GB of unified memory.
For a long time it wasn’t in Ollama, and that’s how this usually goes: the authors publish weights in safetensors, for vLLM and SGLang, the GGUF files Ollama needs are made by the community afterwards, and the Ollama model catalog is curated by hand. By the time a model walks that path, the next one is already out.
A postscript: the community quant landed, and we got to test it.
AntLing/Ling-3.0-flash:Q4_K_M went through our suite with: smoke 4/4, pass-rate 93%, ~26 tok/s,
~5.2 s per turn. It matches laguna-s-2.1 on pass-rate with a turn half as long — with the caveat
that this is a single run, no repeats. That lines up with how the vendor
describes the model: not a
generalist, but a deliberately narrow agent model — less general knowledge, better tool calling and
closing out multi-step tasks. Their “sustainable intelligence” isn’t a marketing line but a set of
tradeoffs: capability is meant to grow faster than the compute needed to serve it. And that single
axis is exactly what we measure. For now we’re staying on gemma4:26b anyway, because the backend
is hardened around it and Ling is still a community release — but it looks very promising.